RCA and De
By implementing solutions to mitigate defects and asset failures on a continual basis, is the tried and true method for improving asset reliability, quality, and productivity performance.
If you’re still not sure where to start, try the 1% rule, as coined by Winston Ledet.
Winston and his team in the United States who ran a computer model, that showed that if you turn 1 out of every 100 reactive work orders into a defect elimination focal point and follow through with the analysis and then the solution recommendations, you can reduce your reactive work order count by 37.5% over three years.
The rate at which your team can retire defects will depend on your organizational maturity, training, and bandwidth to process RCA and De.
Regardless, the key is continuous improvement.
RCA and De do differ in what they target. RCA programs often have a threshold selection criteria for separating the wheat from the chaff and allowing RCA to focus on the most significant problems. De programs on the other hand works with small and less significant events whose mass over time accumulates into a big positive change. Lots of little De improvements add up over time to meet or exceed 1 large RCA improvement.
The top organizations we see are working on both aspects to drive down the generation of defects and RCA candidates over time.
Root Cause analysis and Defect Elimination programs are often very similar.
They both provide a continuous improvement platform your organization can rally behind. The programs in first quartile organizations are often integrated as business as usual processes (BAU), where as in 4th quartile reactive organizations, often there is so little available time, the organization must choose one or the other, or in some cases a blended approach that combines a few methodologies into a cohesive program that occupies the available bandwidth for analysis.
Which type of program is right for you right now? Our answer is this depends on many factors, including the available time and commitment to not just the analysis process, but vitally important is the solution implementation program and its management.
In a 1994 study by Winston Ledet for Du Pont Chemical company, Winston highlighted the importance of defect elimination and RCA in improving reliability. The continual removal of defects, improvement of asset maintenance strategies to combat the underlying failure modes of an asset is still an essential program for any asset management program.
RCA and De can be software agnostic but for preferred methodologies, we prefer to focus on 3 main approaches to De or RCA. For De, the use of 5 Why’s adapted from the LEAN and Quality Improvement programs because it is easy, functional and often captures low hanging fruit.
For more complex and significant problems, often the use of the Ishikawa (Fishbone) diagram and methodology provides fast and reasonably accurate results. For significant incidents, nothing beats the dedicated causal analysis found in the cause and effect diagrams for elevating overlooked root causes and identifying solutions that prevent recurrence.

Expert Facilitation
Getting to the bottom of a major incident requires patience, adherence to investigative methods, and a sound fundamental analysis methodology.
We provide expert trained and independent investigators to facilitate your issue and provide a professional evidence based report with recommendations.
If something big went bang – call us for help!

RCA and De Training
We are not born with the natural toolset required for investigations, RCA analysis, or Defect Elimination programs. These skillsets must be learned and effectively mentored during their early utilization.
We provide training, mentoring and upskilling services including integration with your professional development programs and let us help you empower and equip your staff with the toolset and skills to succeed!

RCA and De program support
Enterprise and site wide programs take thought, dedication and a solid mission plan to succeed. We have been through this journey successfully on many occasions and can help you navigate the dangers, and pitfalls associated with deployment of a program of scale, multi-site, or even multi-country challenges.
Our program designs cater to both internal and enterprise software supported capabilities. Give us a call if this is you!

5 Why’s Analysis
The 5-Whys is a simple brainstorming tool that can help teams identify the root cause(s) of a problem. Asking the 5-Whys allows teams to move beyond obvious answers and reflect on less obvious explanations or causes.
It is said that only by asking “Why?” five times successively, can you delve into a problem deeply enough to understand the ultimate root cause.
By the time you get to the 4th or 5th why, you will likely be looking squarely at management practices (more than five whys may be required for complex problems or a transition into either an Ishikawa or Cause and Effect Analysis).
This methodology is closely related to the cause-and-effect (Fishbone) diagram and can complement the analysis necessary to complete it.
5 Whys are often a key cornerstone of many Defect Elimination programs which require shop floor use of the 5 Why’s approach.
With the correct oversight, this approach is powerful!
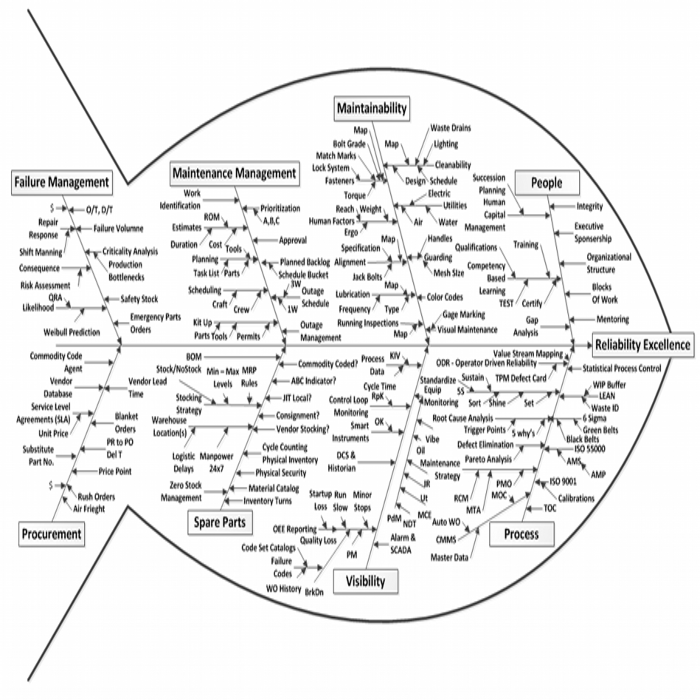
Ishikawa (Fish Bone) Chart
An Ishikawa diagram is a diagram that shows the causes of an event and is often used in manufacturing and product development to outline the different steps in a process, demonstrate where quality control issues might arise, and determine which resources are required at specific times. Its origins date back to the 1960’s originated by Japanese engineer Kaoru Ishikawa and has become a fundamental tool of quality management programs. Its application to Root Cause Analysis and Defect Elimination transcend the boundaries of quality control, and we utilize if as an effective RCA/De tool today.
The primary benefit to the Fishbone is it helps the team and facilitator to identify causes from diverse sources. As long as there is access to a cross functional team of knowledgeable experts, the Fishbone process will identify and group interesting potential causes together by the chosen categories.
The Ishikawa diagram can be used when a full Cause and Effect analysis is not required. It provides a powerful categorization of causes which do not need to follow 6M’s.

Cause and Effect Chart
Navigating all of the possible causes, in the form of actions and conditions that were or were not present at the time of an incident takes practice.
A Cause and Effect chart develops a detailed, evidence-based understanding of the event. It helps to lead us to effective solutions by providing innovative opportunities to eliminate or control the causes of the problem.
Cause and Effect charts by their more through nature do take more time to complete than the 5 Why’s or Ishikawa approaches, and hence are primarily found in practice on more complex problems analyzed under the guise of a formal Root Cause Analysis (RCA) program.
The finished chart will clearly show the causal linkage between the undesired event, and its root causes and the solutions to prevent recurrence.
A final professional report provides a summary of the incident focus, causal analysis, evidence collected, Solutions proposed, and their action status.
Reviews
Bob S.
“Methodical and comprehensive approach. A new way of doing things. Very Knowledgeable and Friendly trainer, Well presented!”
Lisa B.
“The way to analyze problems. The new way to solve problems with the tools necessary to complete the job! Well tailored for our needs and great overview of the RCA and DE process.”
Cheng A.
“Excellent trainer and the course was a good introduction into Root Cause Analysis and Defect Elimination. I really liked the amount of topics covered. The material and tools available were great!”